Practice trading on real history.
Prove it with real rules.
Replay any day on your broker’s own candles, trade it with a virtual account, take a prop-style challenge, and keep every report. All on the MT5 chart you already use.
Helping tools for MetaTrader 5
Made by a trader for traders who build their own strategy. Not signals. Not a course.
786 Simulator Pro
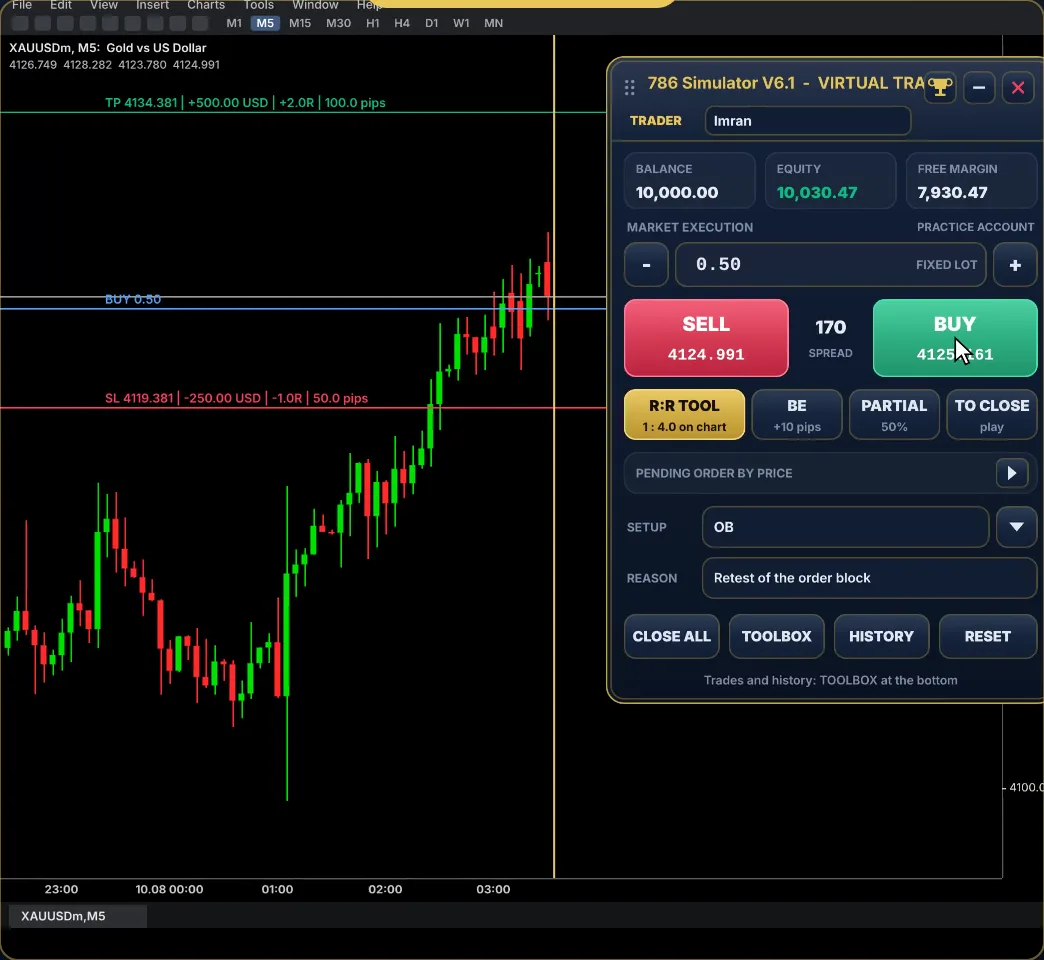
Replay, virtual trading, challenges, reports and review in one tool.
One time $500
For academiesAcademy edition
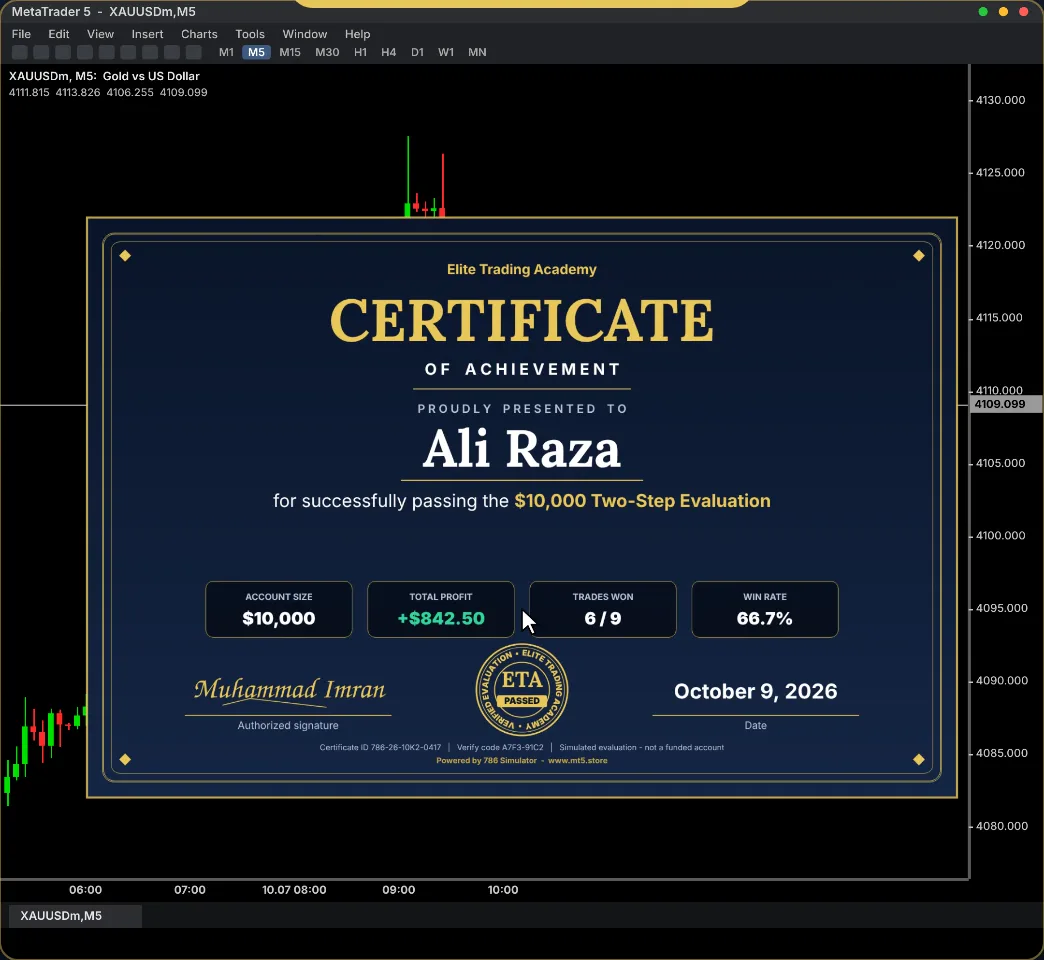
Exams, class tables and your academy name on every certificate.
Price on request
MT5 compatible786 Mini Chart
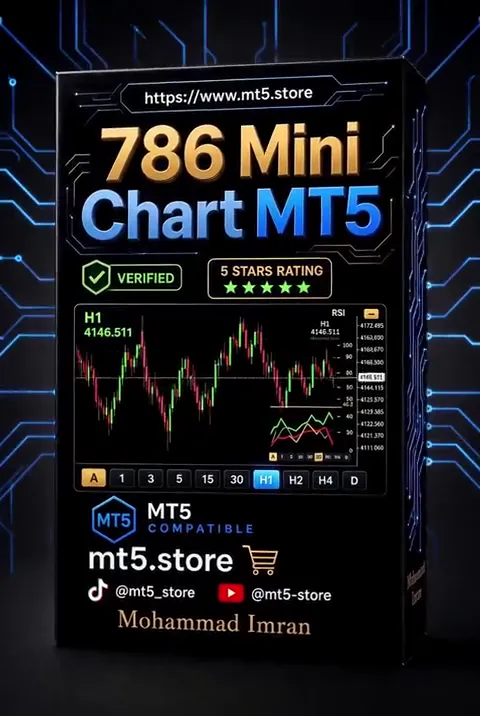
A second timeframe in a small chart on your main chart.
From $25
Drawing tool786 Analysis Tool
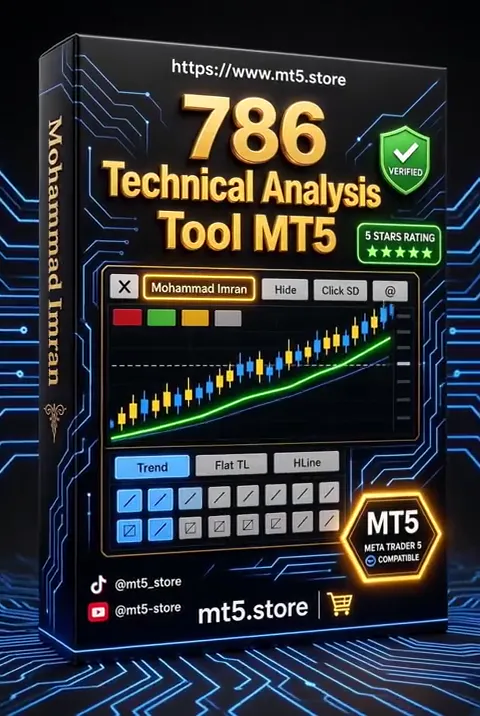
Draw, name and come back to your levels later.
From $30
Any date. Any candle.
Pick a day with the calendar, or press REPLAY and click a candle. Play, pause and step with Space, Left and Right. Switch timeframes while you replay.
- Your broker’s own candles inside MT5
- Speeds from 1x to 25x
- Back to LIVE in one click
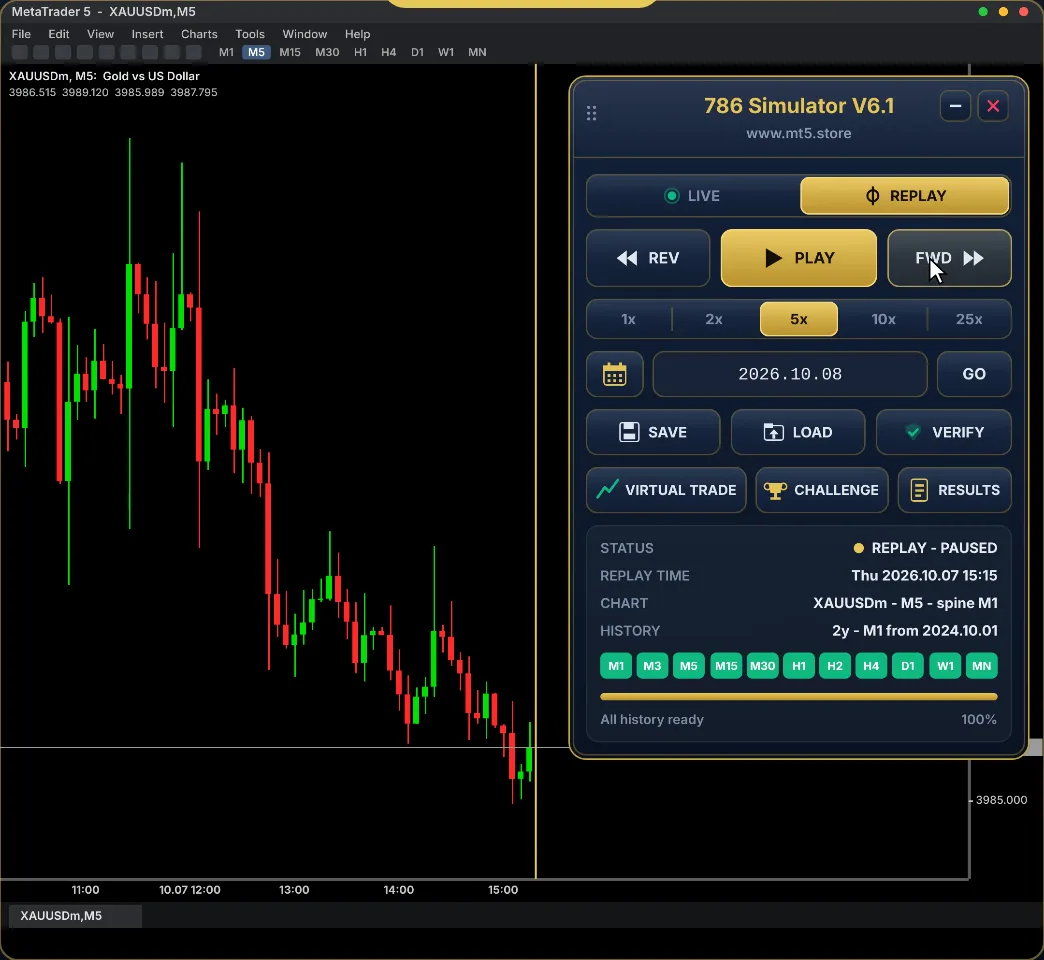
Trade the past. Zero risk.
A virtual account with balance, equity and margin. Market and pending orders, SL and TP you can drag, break even, partial close and an R:R planner.
- Pips, dollars and R on every line
- Toolbox with trades, history, journal and stats
- Setup and reason saved with each trade
Discipline is the real target.
Prop-style practice challenges from 5K to 100K: 1-Step, 2-Step or Instant, with profit targets, daily loss, max loss and trading days. Break one rule and the account is over, just like a real evaluation.
- Rules locked after BEGIN
- Live meters for target and loss limits
- PASSED certificate with ID and verify code
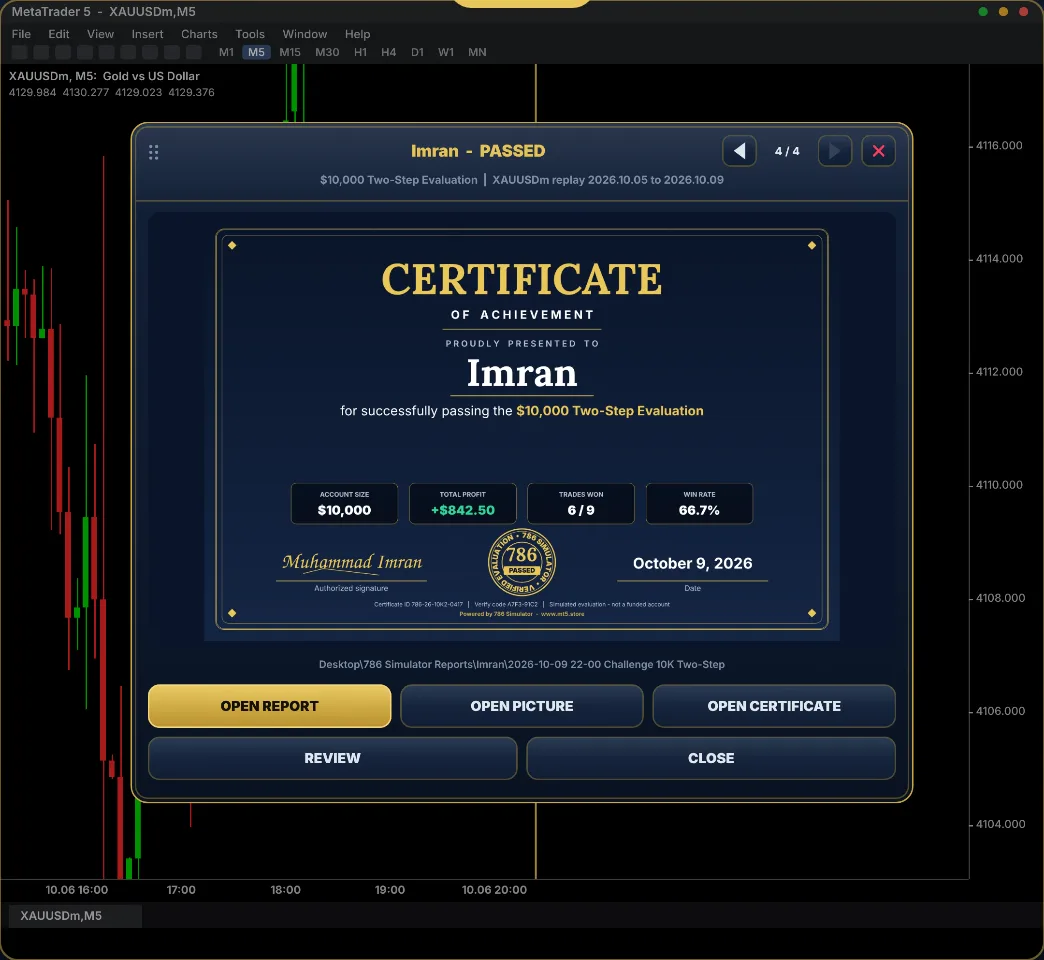
Practice where you really trade
Most replay tools live outside MetaTrader. 786 Simulator works on the MT5 chart itself.
| Outside / web replay tools | 786 Simulator | |
|---|---|---|
| Candles | Usually from the tool’s own data server | ✓ Your broker’s own candles in MT5 |
| Where you practise | A separate website or app | ✓ The same MT5 chart you trade live |
| Back to live | Close it and open MT5 | ✓ One click: LIVE |
| Uploads and downloads | Often needed | ✓ Nothing to upload |
| Prop-style challenge practice | Varies | ✓ Built in (Pro) |
| Your reports | In an online account | ✓ On your own Desktop |
Ready to practise the way professionals do?
One payment, lifetime licence for one MT5 account. Order on WhatsApp with your MT5 account number.